Usage Efficiency Report & Layer
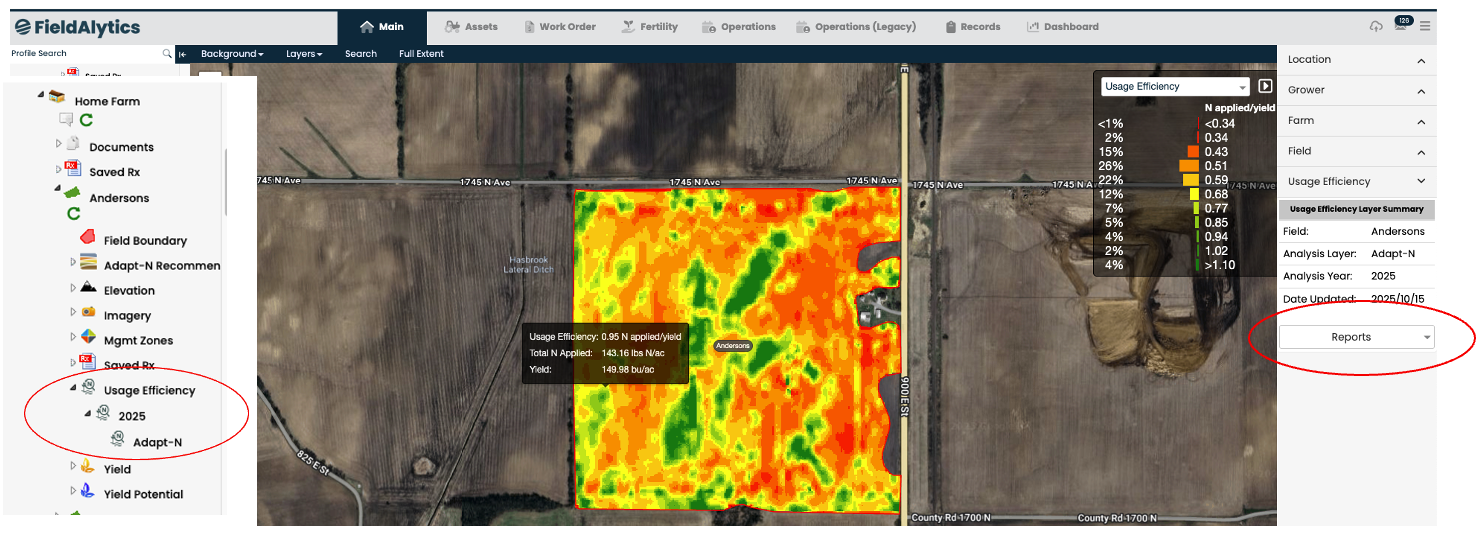
We’re introducing a powerful new way to visualize nitrogen performance across your fields. The Usage Efficiency Tool when selected to run generates a new map layer within the Main tree under each Adapt-N field. This layer calculates how efficiently nitrogen was used by comparing total nitrogen applied to yield results for each raster cell.
How It Works
The Usage Efficiency layer is created by dividing the total nitrogen applied (lbs N/ac) by the actual yield (bu/ac) for each cell, producing a Usage Efficiency ratio:
Usage Efficiency = N applied ÷ Yield
Lower values indicate more efficient nitrogen use (less N applied per bushel produced), while higher values highlight areas where nitrogen use was less efficient.
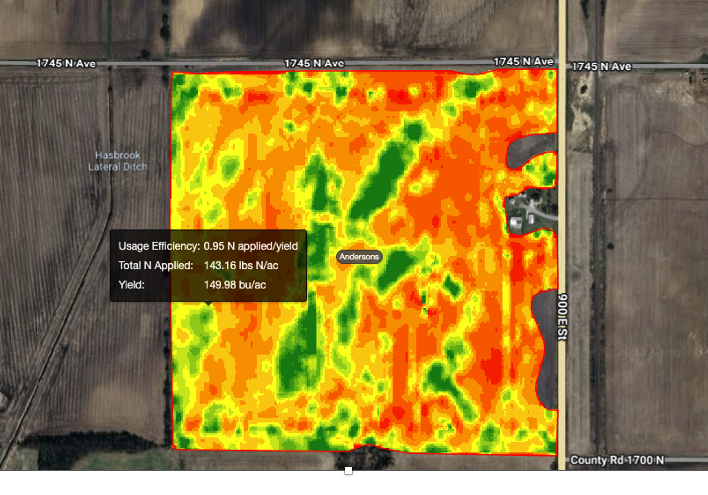
Each raster cell in the layer displays:
- Usage Efficiency (N applied/yield)
- Total N Applied (lbs N/ac)
- Yield (bu/ac)
Hover over any cell on the map to view these values in real time as seen below.
Generate the Usage Efficiency Layer & Report
Prerequisites
- You’ve entered all N applications for the season in Adapt-N (pre-plant, in-season, manure).
- You have a yield map for the year you want to analyze.
Steps
- Load your latest Adapt-N recommendation
- In the field tree, open the most recent Adapt-N Recommendation.
- Confirm your nitrogen applications are configured for the season.
- Trigger the raster
- In the right-hand panel, click Trigger Raster.
- FieldAlytics will convert the recommendation to a raster and write Total N Applied (lbs N/ac) to each cell.
- Open Usage Efficiency
- Return to the Field level.
- Go to Tools → Usage Efficiency.
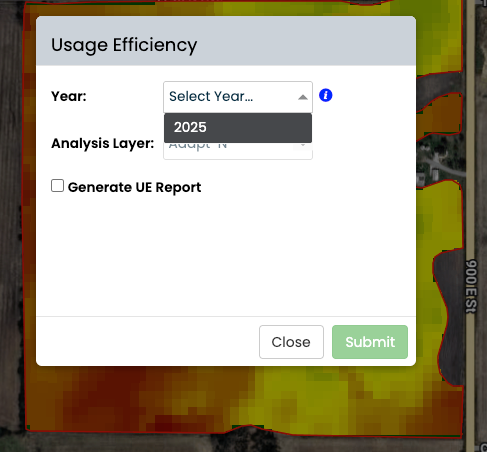
- Choose the analysis year
- Select the Year to analyze.
- Only years with a yield map will be selectable.
- Create the layer (and optional report)
- Finally, you’ll be prompted to Generate UE Report.
- If you check to generate it now, the PDF is delivered to your Notifications Center.
-
- If you skip it, you can open the layer later from the field tree and click Reports to generate/print.

Errors & tips
-
“No Adapt-N raster found.”
This appears when the selected yield year doesn’t have a valid Adapt-N raster.
Fix: Download the latest Adapt-N recommendation and Trigger Raster, then try Usage Efficiency again.
-
Why can’t I pick a year?
The Year menu only lists seasons with an available yield map.
-
Where is my report?
Completed PDFs appear in the Notifications Center. You can also reprint from the layer’s Report button.
Need Help Setting Up Adapt-N?
If you haven’t used Adapt-N before, you’ll need to complete setup before running the Usage Efficiency tool. Here is the link to the Adapt-N setup instructions.